DynaTrace Ajax Edition
First, DynaTrace provides a very good tool "DynaTrace Ajax Edition" for Web performance testing and profiling. The dynaTrace Ajax Edition 3 makes building lightning fast Web 2.0 applications easy. Speed page load times, optimize rendering, tune DOM execution, and compare to competition. Even integrate with Selenium, Watir or QTP to begin automating your performance tests. It's free, it's easy and it's now for both Firefox and IE.
KPI (Key performance indicators)
First Request
First Impression
onLoad Time
Fully Loaded
On Server
On Client
Interactive
DNS
Connect
Transfer
Wait
Network
Javascript
Rendering
Total Size
# of request
# of XHR(Ajax)
Problems:
#1 Problem - Overloaded web sites
Expensive redirecvt
#2 Javascript Execution
Script block execution
Expensive lookup by ClassName getElementsByClassName()
#3 Old javascript libraries
#4 Caching
#5 Slow External Content (Ads, banners, Social network plugins)
Psychological response time:
Page load time < 4s for first time vistors
< 2s for revisisting users
Proactive Performance Optimization:
- Leverage Browser Caching
- Reduce Network Roundtrips
- Optimize Javascript
- Optimize DOM Manipulations
- Analyze external Content
- Optimize Ajax Usage
- Analyze Rendering
- Test CROSS Browser
 |
| Figure 1: Performance Testing |
 |
| Figure 2: Using DynaTrace |
 |
| Figure 3: Why using DynaTrace |
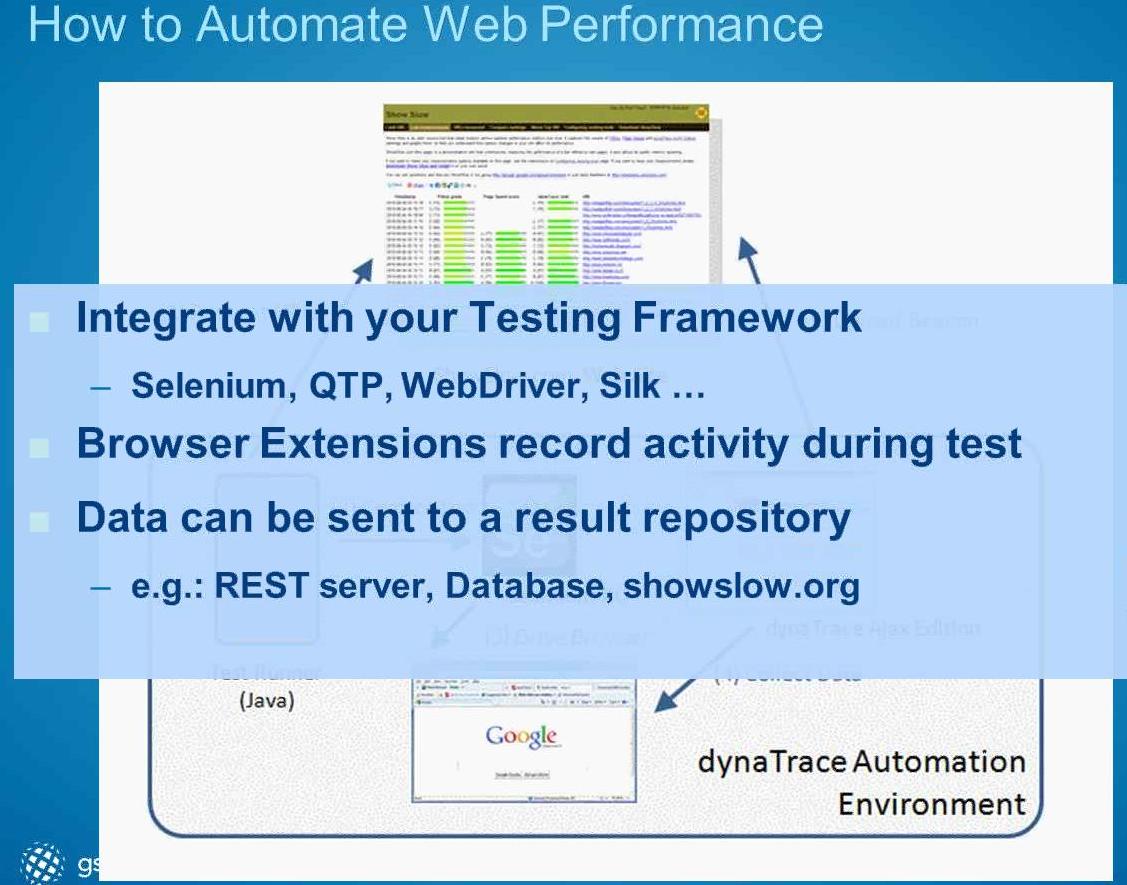 |
| Figure 4: Automate |
 |
| Figure 5: Tips and Tricks |
 | |||||
| Figure 6: Next Step using DynaTrace |
 |
| Figure 7: Roundup |
No comments:
Post a Comment