Many extensions to Firefox
http://lesliefranke.com/files/firefoxwdev/firefoxwdev.htm
The slide "Web Development with Firefox" basically has 3 parts:
Built-in Tools
View page source - Ctrl+U
View selection source
Page Info
Error Console (Ctrl+Shift+J)
DOM Inspector (Inspect Element)
Web Development Extensions
Web Developer Extension http://chrispederick.com/work/web-developer/
Accessibility -> Accessibility Extensions for Firefox/Fangs/Accessibar
Colors -> Colorzilla
Cookies -> Add & Edit Cookies/View Cookies
CSS -> CSSViewer/Aardvark
Debugging -> Firebug
Links -> LinkChecker
Measurements -> MeasureIt
Page Information -> Extended Statusbar/MetaTags Sidebar
Page Parameters -> Live HTTP Headers/UrlParams
User Agents -> User Agent Switcher
View Pages in Other Browsers -> IE Tab/IE View/OperaView/FirefoxView
Validation -> HTML Validator
Bookmarklets (favlets) -> Slayer Office/Square Free
Developer Tools Extensions (to replace FileZilla/Nvu)
Editors -> Codetch
FTP -> Fireftp
Images -> MozImage
Screenshots -> Pearl Crescent Page Saver/Screen Grab
Wednesday, March 30, 2011
Social Gaming and Apps in the Cloud (from RightScale)
This webinar actually talked about 3 things: AWS, ServerTemplate and Membase.
AWS - Amazon Web Services, which provides many PaaS (Platform as a service) features like computing, messaging, storage, network, management, monitoring and tools and etc. Socail gaming and apps can be developed on top of it. It is similar to Google App Engine.
ServerTemplate - It is used to define the configuration settings for a new application server.
Membase - Memcached based distributed K/V store
AWS - Amazon Web Services, which provides many PaaS (Platform as a service) features like computing, messaging, storage, network, management, monitoring and tools and etc. Socail gaming and apps can be developed on top of it. It is similar to Google App Engine.
 | |
| Figure 1: AWS Stack |
 |
| Figure 2: AWS Advantages |
ServerTemplate - It is used to define the configuration settings for a new application server.
 | |||
| Figure 3: Reusable Server Templates |
Membase - Memcached based distributed K/V store
 | |||
| Figure 4: Simple Membase |
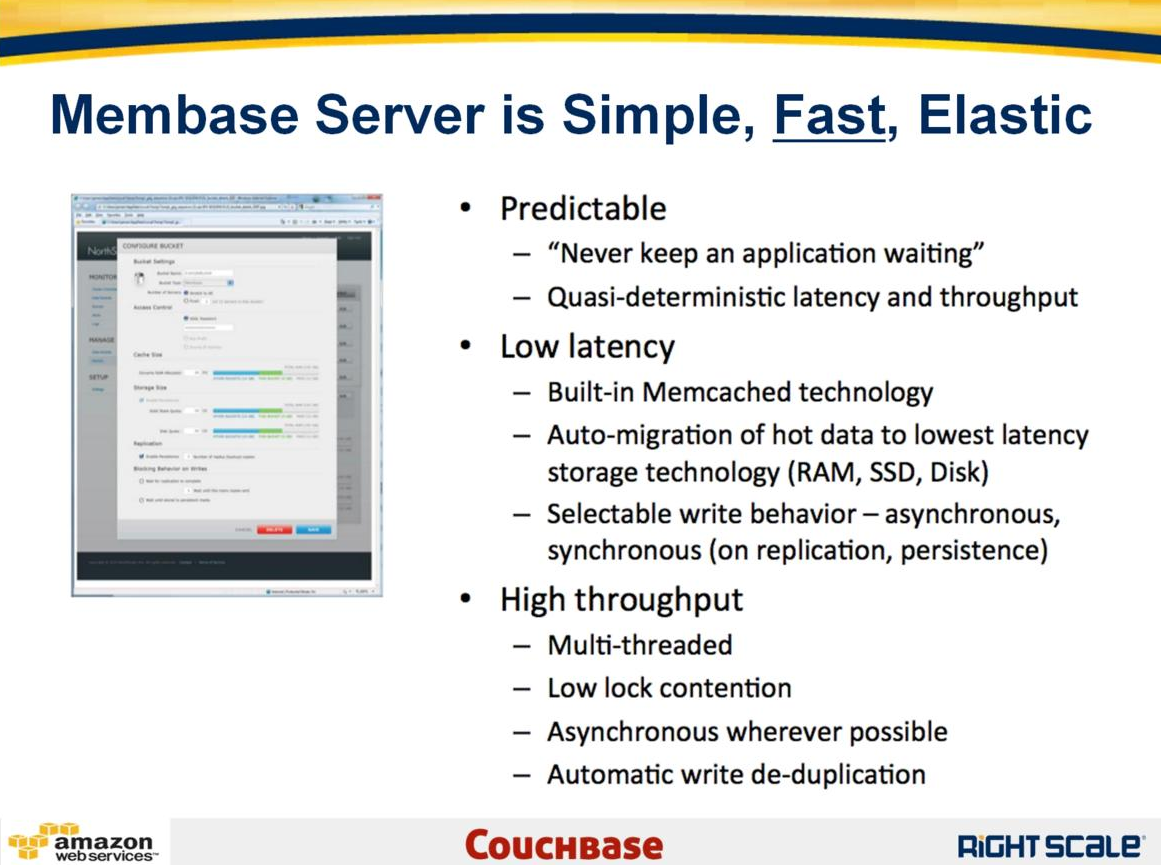 | |
| Figure 5: Fast Membase |
 |
| Figure 6: Elastic Membase |
Best Practices to Optimize Web 2.0 Performance (DynaTrace)
The webinar is about web2.0 optimization from DynaTrace.
DynaTrace Ajax Edition
First, DynaTrace provides a very good tool "DynaTrace Ajax Edition" for Web performance testing and profiling. The dynaTrace Ajax Edition 3 makes building lightning fast Web 2.0 applications easy. Speed page load times, optimize rendering, tune DOM execution, and compare to competition. Even integrate with Selenium, Watir or QTP to begin automating your performance tests. It's free, it's easy and it's now for both Firefox and IE.
KPI (Key performance indicators)
First Request
First Impression
onLoad Time
Fully Loaded
On Server
On Client
Interactive
DNS
Connect
Transfer
Wait
Network
Javascript
Rendering
Total Size
# of request
# of XHR(Ajax)
Problems:
#1 Problem - Overloaded web sites
Expensive redirecvt
#2 Javascript Execution
Script block execution
Expensive lookup by ClassName getElementsByClassName()
#3 Old javascript libraries
#4 Caching
#5 Slow External Content (Ads, banners, Social network plugins)
Psychological response time:
Page load time < 4s for first time vistors
< 2s for revisisting users
Proactive Performance Optimization:
- Leverage Browser Caching
- Reduce Network Roundtrips
- Optimize Javascript
- Optimize DOM Manipulations
- Analyze external Content
- Optimize Ajax Usage
- Analyze Rendering
- Test CROSS Browser
 |
| Figure 1: Performance Testing |
 |
| Figure 2: Using DynaTrace |
 |
| Figure 3: Why using DynaTrace |
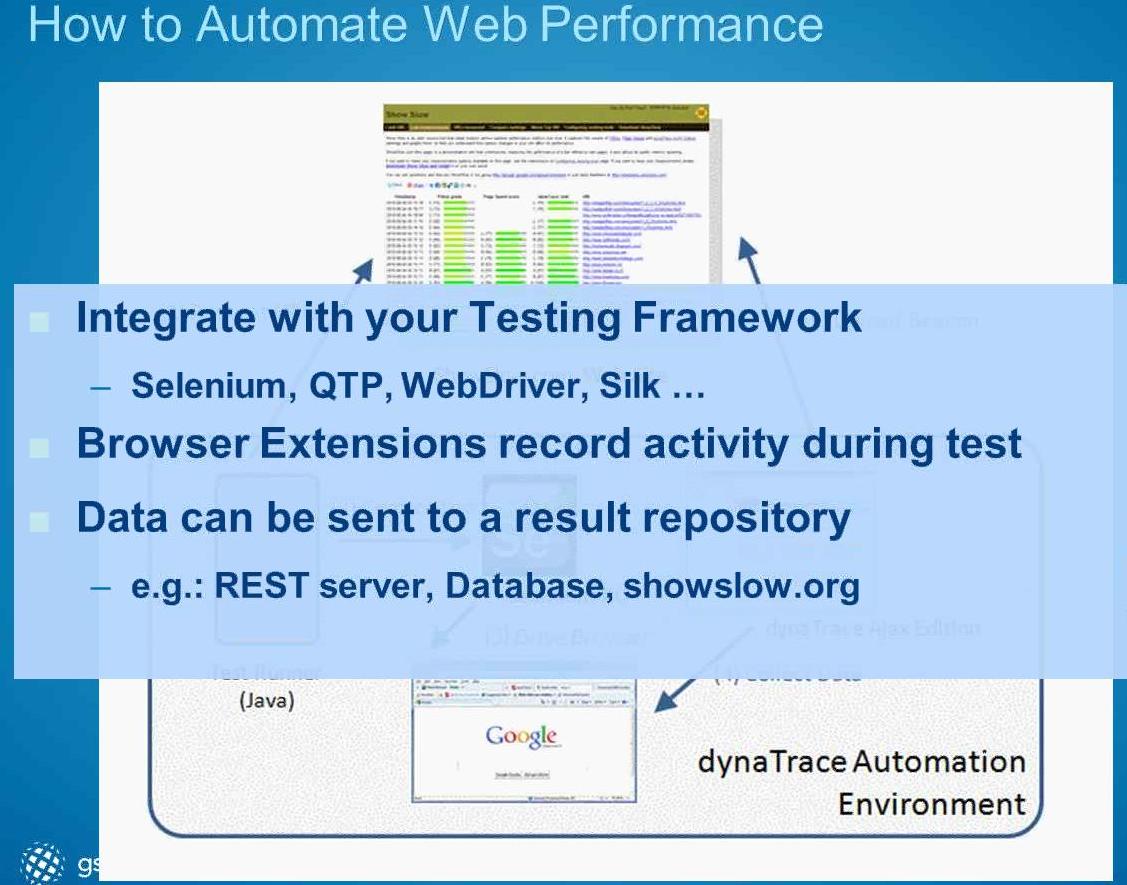 |
| Figure 4: Automate |
 |
| Figure 5: Tips and Tricks |
 | |||||
| Figure 6: Next Step using DynaTrace |
 |
| Figure 7: Roundup |
Tomcat CPU 100% Issue
In testing environment, we found tomcat (v6.0.18) CPU 100% under no load. To troubleshoot this issue, we first identified the thread took most of CPU using below 3 steps:
Step1 -- use top -H to get which java thread occupies the CPU mostly
Step2 -- use kill -3 to do thread dump
Step3 -- use Step1 java thread pid (Dec Format) to get the thread information from Step2 by nid (Hex format)
The runnable thread took 100% CPU is:
"http-8080-Poller-0" daemon prio=10 tid=0x00002aabd85b7400 nid=0x2dfe runnable [0x000000004b248000..0x000000004b248c90]
java.lang.Thread.State: RUNNABLE
at org.apache.tomcat.jni.Poll.poll(Native Method)
at org.apache.tomcat.util.net.AprEndpoint$Poller.run(AprEndpoint.java:1298)
at java.lang.Thread.run(Thread.java:619)
After Google, we found it was a bug in Tomcat APR native code.
https://issues.apache.org/bugzilla/show_bug.cgi?id=40525
The jni native method poll() in poll.c does not check if the socket has no
timeout (i.e. it does not check if max_ttl is negative) before adjusting the
timeout passed to apr_pollset_poll().
The timeout passed to apr_pollset_poll() is in the variable 'ptime'. The
current code sets ptime to zero when there is a valid timeout (usually 2000ms)
and no socket timeout (usually -1000).
These values are common because AprEndpoint.java defaults to pollTime=2000 ms
and soTimeout=-1 sec (which gets adjusted to -1000 ms).
When a zero timeout is passed to apr_pollset_poll(), it is passed along to the
native select() as a zero timeval which causes select() to return immediately
instead of blocking. A negative value should be passed to apr_pollset_poll() for
an infinite timeout, but I don't think that's what we want here.
The observed result is 100% cpu use when Tomcat is idle because calls to poll()
are made continuously. These calls return immediately.
The solution is to recognize when max_ttl is negative, and if so; do not use it
to adjust the 'ptime' variable passed as an argument to poll(). Here is a patch
for http://svn.apache.org/repos/asf/tomcat/connectors/trunk/.
APR (Apache Portable Runtime) is tomcat native library which is tomcat core to provide OS/native process functionalities. Tomcat has 3 connector types: HTTP, AJP and APR. Usually we use http and have following configurations
Tomcat server.xml default configuration has below sample:
<!-- A "Connector" represents an endpoint by which requests are received
and responses are returned. Documentation at :
Java HTTP Connector: /docs/config/http.html (blocking & non-blocking) (JIO/NIO)
Java AJP Connector: /docs/config/ajp.html
APR (HTTP/AJP) Connector: /docs/apr.html
Define a non-SSL HTTP/1.1 Connector on port 8080
-->
<Connector port="8080" protocol="HTTP/1.1"
connectionTimeout="20000"
redirectPort="8443" />
On our testing server, we have tomcat 6.0.18 and native library 1.1.14 installed. And if we don't specify protocol, it seems to default to use APR with below configuration (no protocol specified)
Usually we need specify protocol="org.apache.coyote.http11.Http11AprProtocol" for APR connector. If we don't have native library installed, we usually see below INFO when start tomcat.
2006-06-05 19:50:26 org.apache.catalina.core.AprLifecycleListener
INFO: The Apache Tomcat Native library which allows optimal performance in
production environments was not found on the
java.library.path: /usr/local/opt/sun-jdk-1.5.0.06/jre/lib/i386/client:/usr/local/opt/sun-jdk-1.5.0.06/jre/lib/i386:/usr/local/opt/sun-jdk-1.5.0.06/jre/../lib/i386
Updated 4/25/2012
For some system not supporting top -H, we can use ps command which has -m or -L to list out thread info. Examples:
ps -emo pid,tid,class,rtprio,stat,comm ps -eL 18975
Step1 -- use top -H to get which java thread occupies the CPU mostly
Step2 -- use kill -3 to do thread dump
Step3 -- use Step1 java thread pid (Dec Format) to get the thread information from Step2 by nid (Hex format)
The runnable thread took 100% CPU is:
"http-8080-Poller-0" daemon prio=10 tid=0x00002aabd85b7400 nid=0x2dfe runnable [0x000000004b248000..0x000000004b248c90]
java.lang.Thread.State: RUNNABLE
at org.apache.tomcat.jni.Poll.poll(Native Method)
at org.apache.tomcat.util.net.AprEndpoint$Poller.run(AprEndpoint.java:1298)
at java.lang.Thread.run(Thread.java:619)
After Google, we found it was a bug in Tomcat APR native code.
https://issues.apache.org/bugzilla/show_bug.cgi?id=40525
The jni native method poll() in poll.c does not check if the socket has no
timeout (i.e. it does not check if max_ttl is negative) before adjusting the
timeout passed to apr_pollset_poll().
The timeout passed to apr_pollset_poll() is in the variable 'ptime'. The
current code sets ptime to zero when there is a valid timeout (usually 2000ms)
and no socket timeout (usually -1000).
These values are common because AprEndpoint.java defaults to pollTime=2000 ms
and soTimeout=-1 sec (which gets adjusted to -1000 ms).
When a zero timeout is passed to apr_pollset_poll(), it is passed along to the
native select() as a zero timeval which causes select() to return immediately
instead of blocking. A negative value should be passed to apr_pollset_poll() for
an infinite timeout, but I don't think that's what we want here.
The observed result is 100% cpu use when Tomcat is idle because calls to poll()
are made continuously. These calls return immediately.
The solution is to recognize when max_ttl is negative, and if so; do not use it
to adjust the 'ptime' variable passed as an argument to poll(). Here is a patch
for http://svn.apache.org/repos/asf/tomcat/connectors/trunk/.
APR (Apache Portable Runtime) is tomcat native library which is tomcat core to provide OS/native process functionalities. Tomcat has 3 connector types: HTTP, AJP and APR. Usually we use http and have following configurations
Tomcat server.xml default configuration has below sample:
<!-- A "Connector" represents an endpoint by which requests are received
and responses are returned. Documentation at :
Java HTTP Connector: /docs/config/http.html (blocking & non-blocking) (JIO/NIO)
Java AJP Connector: /docs/config/ajp.html
APR (HTTP/AJP) Connector: /docs/apr.html
Define a non-SSL HTTP/1.1 Connector on port 8080
-->
<Connector port="8080" protocol="HTTP/1.1"
connectionTimeout="20000"
redirectPort="8443" />
On our testing server, we have tomcat 6.0.18 and native library 1.1.14 installed. And if we don't specify protocol, it seems to default to use APR with below configuration (no protocol specified)
<Connector port="8080" maxHttpHeaderSize="8192"
maxThreads="150" minSpareThreads="25" maxSpareThreads="75"
enableLookups="false" redirectPort="8443" acceptCount="100"
connectionTimeout="0" disableUploadTimeout="true"
compression="on" compressionMinSize="1024" URIEncoding="UTF-8"
noCompressionUserAgents="gozilla, traviata"
compressableMimeType="text/html,text/xml,text/javascript,application/x-javascript,application/xml,application/javascript,text/css,text/plain"/>
Usually we need specify protocol="org.apache.coyote.http11.Http11AprProtocol" for APR connector. If we don't have native library installed, we usually see below INFO when start tomcat.
2006-06-05 19:50:26 org.apache.catalina.core.AprLifecycleListener
INFO: The Apache Tomcat Native library which allows optimal performance in
production environments was not found on the
java.library.path: /usr/local/opt/sun-jdk-1.5.0.06/jre/lib/i386/client:/usr/local/opt/sun-jdk-1.5.0.06/jre/lib/i386:/usr/local/opt/sun-jdk-1.5.0.06/jre/../lib/i386
Updated 4/25/2012
For some system not supporting top -H, we can use ps command which has -m or -L to list out thread info. Examples:
ps H
-eo user,pid,ppid,tid,time,%cpu,cmd -p 17545 --sort=%cpu
For sun Linux, use ps -efL, -L option will show the LWPs
Also try prstat -L -v -u weblogicSaturday, March 19, 2011
Beyond Web performance 14 rules
Yahoo! developer network summarized other rules, and built some into YSlow
Flush the buffer early
Use GET for AJAX requests
Post-load components
Preload components
Reduce the number of DOM elements
Split components across domains
Minimize the number of iframes
No 404s
Reduce cookie size
Use cookie-free domains for components
Minimize DOM access
Develop smart event handlers
Choose <link> over @import
Avoid filters
Optimize images
Optimize CSS sprites
Don't scale images in HTML
Make favicon.ico small and cacheable
Keep components under 25K
Pack components into a multipart document
Friday, March 11, 2011
Redirect thread dump to another file?
On Tomcat application server, we usually use kill -3 PID to get thread dump to default STDOUT which is catalina.out under $Tomcat_Home/logs folder. It might be nature to use command kill -3 PID > some.file 2>&1 to try to redirect the thread dump info to some.file than default one. However, it will not work. The reason is kill is just a command to send a signal to a process. You are redirecting the output of the kill command itself rather than the process (what the process does upon receipt of a signal is separate), so the redirect (supposed to kill command itself) has no effect on which file the process (PID) will write to. Given that, if we need redirect thread dump for that process to some other file, we need add redirects to that process when it starts.
Another popular way is to use jstack -F PID to get the whole thread dump forcefully."jstack": A JVM troubleshooting tool that prints stack traces of all running threads of a given JVM process, a Java core file, or remote debug server. It comes with JDK so it is free too. :-)
Here are some explanations about frequently used linux cmd > /dev/null 2>&1
There are three standard sources of input and output for a program. Standard input usually comes from the keyboard if it’s an interactive program, or from another program if it’s processing the other program’s output. The program usually prints to standard output, and sometimes prints to standard error. These three file descriptors (you can think of them as “data pipes”) are often called STDIN, STDOUT, and STDERR. Sometimes they’re not named, they’re numbered! The built-in numberings for them are 0, 1, and 2, in that order. The default is STDOUT if you don't name or number.
That means file descriptor 0 or fd0 denotes STDIN or standard input and file descriptor 1 or fd1 denotes STDOUT or standard output and file descriptor 2 or fd2 denotes STDERR or standard error.
You can see the command above is redirecting standard output into /dev/null, which is a place you can dump anything you don’t want (often called the bit-bucket), then redirecting standard error into standard output (you have to put an & in front of the destination when you do this).
The short explanation, therefore, is “all output from this command should be shoved into a black hole.” That’s one good way to make a program be really quiet!
Note: I somehow lost the original link to the post which includes above explanation. I copied here as it is very clear and easy to understand. Thanks the original poster for contribution.
Sunday, March 6, 2011
Web Performance Tools
Firebug
YSlow
Page Speed
Speed Tracer (Chrome)
HttpWatch
DynaTrace's Ajax Edition
webpagetest
Web Inspector
Chrome Dev Tools
fiddler2
HttpAnalyzer
IE Developer Toolbar
yuiCompressor
http://csssprites.com/
SpriteMe
jawr.java.net
Cuzillion
OctaGate SiteTimer
JSMin
AlertSite Dejaclick recorder
cuzillion (steve sounders)
Doloto from Microsoft
www.csssprites.com
spritegen.website-performance.org
pngcrush (optipgn, pngoptimizer, gifsicle)
jpgetran
imagemagick
png2ico
AOL pagetest
IMB Page Detailer
LiveHttpHeader
JSLint
JDrop
Thursday, March 3, 2011
Web Performance Sites
http://www.webperformancetoday.com/
http://www.perfplanet.com/
http://stevesouders.com/
Top methods for Faster, Speedier web sites
http://www.askapache.com/web-cache/top-methods-for-faster-speedier-web-sites.html
BetterExplained Learn Right, Not Rote.
http://betterexplained.com/
http://www.tutkiun.com/2010/07/load-javascript-after-pageload.html
http://www.codeproject.com/KB/aspnet/CombineAndMinify.aspx
http://dean.edwards.name/packer/
http://www.jslint.com/
http://www.sitepoint.com/article/web-site-optimization-steps
http://livehttpheaders.mozdev.org/
http://yuiblog.com/blog/2007/01/04/performance-research-part-2/
- http://jsbeautifier.org/
- Microsoft ajax minifier – The Microsoft Ajax Minifier enables you to improve the performance of your Ajax applications by reducing the size of your Cascading Style Sheet and JavaScript files (which also provides the hypercrunch option to make it less readable)
- http://javascriptobfuscator.com/default.aspx – This uses obfuscation techniques (shown in image above!). Nice.
- There is also the YUI JS Compressor – http://developer.yahoo.com/yui/compressor/
- http://dean.edwards.name/packer/
- encode base 64 – http://www.shell-tools.net/index.php?op=base64_enc
- decode base 64 – http://www.shell-tools.net/index.php?op=base64_dec
Subscribe to:
Posts (Atom)